
If you’ve ever worked in logistics, you know the juggling act: coordinating vehicles, warehouses and ever-changing data, all while keeping up with rising customer expectations.
Sound familiar?
Today’s logistics world demands clear visibility and faster decision-making at every level.
A well-designed logistics dashboard delivers exactly that. More than displaying data, it’s a command center that offers clarity, agility and control.
Say a fleet manager spots a delayed shipment highlighted in red. With a single click, alternate routes are instantly available, no need to sift through spreadsheets or switch between systems.
Having this kind of clarity gives your team the boost to respond quickly and make smarter choices.
In this article we’ll share dashboard design strategies that not only simplify complex operations but also empower your teams and give your business the confidence to move forward with ease.
Reasons to Invest in Logistics Dashboard Design
Managing daily operations is one thing. But building a business that’s ready to scale and adapt to the future? That’s a whole different game.
Investing in a well-designed dashboard UI goes beyond looks, it’s a game changer for how your business grows and evolves. Here’s why:
1. Accelerating Growth: Move Faster, Smarter
The Pain Point: Managing real-time data across shipments, inventory and drivers can feel like a juggling act. Outdated tools can’t keep up, leading to missed opportunities and costly mistakes.
The Solution: A well-designed logistics analytics dashboard brings clarity to the chaos, enabling quick, confident, data-driven decisions. The result? Fewer errors, fewer delays and smoother operations.
Example: One client we worked with used a predictive logistics dashboard to reroute shipments before delays even occurred. The payoff? Time saved, stronger customer trust and consistently on-time deliveries.
More than just the speed, a thoughtful UX reduces cognitive load, so teams can process and act on information without being overwhelmed by cluttered screens or irrelevant data.
2. Improving Customer Retention: Clarity Drives Loyalty
The Pain Point: Customers want updates and fast. If they’re left in the dark, confused or constantly chasing information, satisfaction drops and loyalty suffers.
They need to know you’re invested in their success.
The Solution: A clean, intuitive dashboard UI with real-time updates and tailored views keeps customers informed and engaged. Everyone gets exactly the information they need, when they need it.
Example: A startup we helped, used a customer segmentation dashboard to deliver customised updates for both B2B and B2C clients.
The result? Higher retention, stronger satisfaction and happier customers all around.

And let’s not forget the power of transparency: when customers feel like they’re in the loop, they’re more forgiving when hiccups happen.
3. Boosting Conversion Rates: Make It Easy to Upgrade
The Pain Point: If your dashboard is hard to use, customers won’t fully explore your services. Advanced features and premium options get overlooked simply because they’re buried, unclear or overwhelming. When the experience is confusing, upsell opportunities disappear.
The Solution: A clear, intuitive and personalized dashboard helps users quickly understand the value of advanced features.
By showing insights like “You could save $X with Route Optimizer Pro” or using gentle nudges like tooltips and callouts, your dashboard sparks curiosity and guides customers toward premium features that actually feel relevant.
Bonus Insight: The Hidden ROI of UX/UI
Good dashboard design does more than improve your customer experience, it can also help your team work smarter.
A well-designed logistics dashboard with clean layouts and role-specific views helps your team work more smoothly, cut through bottlenecks, make faster decisions and minimize errors.
This means you’re not just improving the experience for your customers but for your team as well.
And here’s the kicker: a strong UX strategy reduces onboarding time. New team members can learn the ropes faster thanks to intuitive layouts, clear navigation and role-based dashboards that show exactly what they need and nothing more.

What Makes a Logistics Dashboard Truly Effective?
At its best, a logistics dashboard gives your team the insight and control they need to respond quickly and keep operations on track. Let’s explore what makes it truly effective:
Design considerations for UI/UX Optimisations
The most important are:
- Role-Based Personalisation: Different roles need different views. A fleet manager, a warehouse operator and a customer service representative all need different information. Tailoring these views ensures everyone gets what they need without clutter or distraction.
- Intuitive Navigation: A clean layout, color-coded alerts and clear UI patterns help users stay focused on the important stuff, even when the pressure is on.
- Scalability: Your dashboard should grow with your business. Flexible systems mean you can expand operations without outgrowing your tools.
- Consistent Design System: Consistent fonts, colors, icons and spacing make the dashboard visually clear and predictable. This boosts confidence, reduces mistakes and speeds up decision-making.
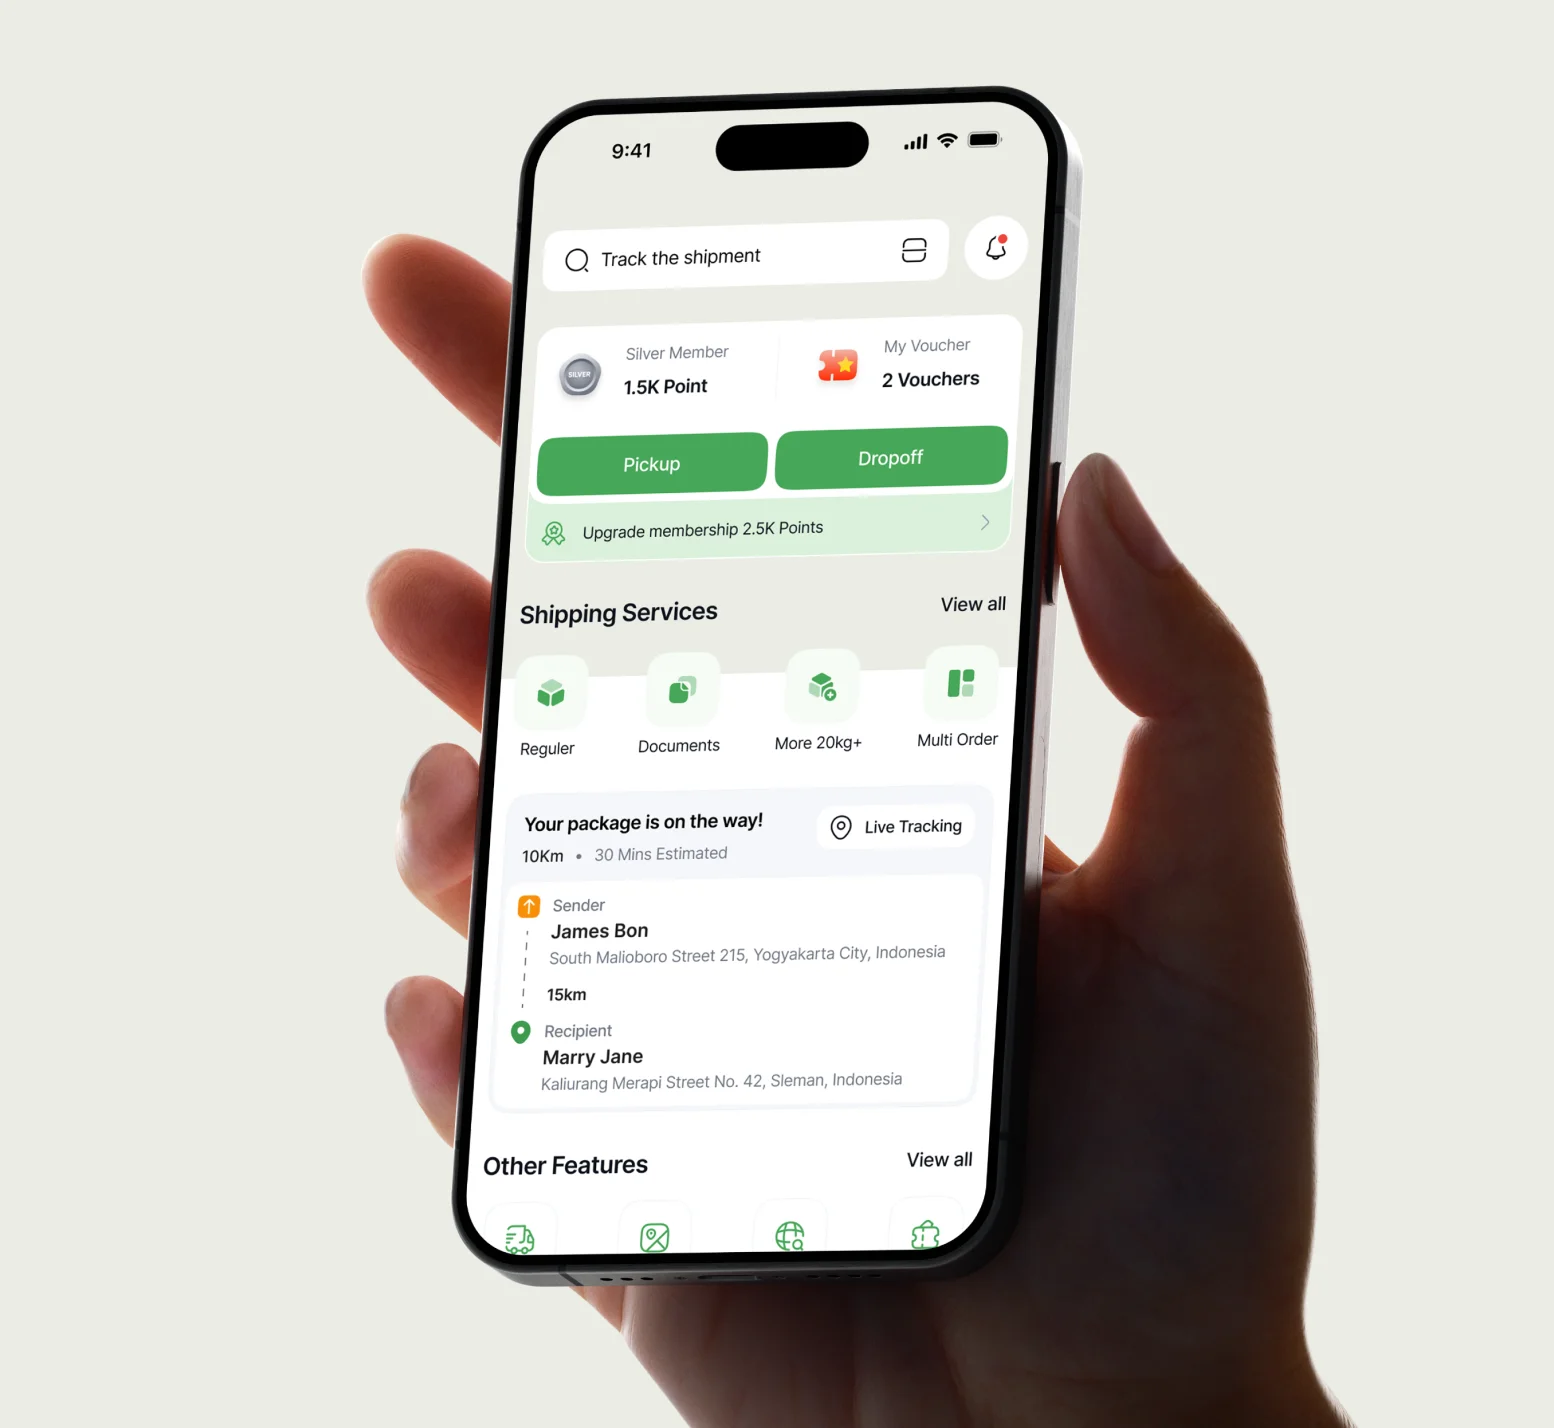
- Mobile Responsiveness: Logistics happens on the move. Dashboards need to adapt seamlessly to mobile and tablet screens, ensuring drivers, pickers and managers have the right information at their fingertips wherever they are.
- Custom dashboards designed with these principles make work easier, faster and more efficient for everyone on the team.
To ensure your dashboard is truly effective, it’s essential to design with real user needs in mind, which is where research plays a key role.
Research First, Then Design
A good dashboard doesn’t start with charts, it starts with people. To build a dashboard that solves real problems, you need to understand real users.
Great dashboards don’t just look good; they solve real, day-to-day challenges.
Whether you’re using a custom-built tool or an out-of-the-box logistics solution, taking the time to research your users first is critical.
Here’s how to make sure your dashboard truly adds value.
Talk to Your Users
After years of logistics experience, you know the pain points better than anyone. Speak with your team-fleet managers, warehouse leads and customer support reps to identify where the inefficiencies are.
What data are they constantly searching for? What causes confusion or slowdowns?

Analyse Usage Patterns
Pay attention to how your dashboard is actually being used. Which features get the most clicks and which ones are barely touched? This insight lets you prioritise frequently used tools, declutter what’s unnecessary and create a dashboard that fits your team’s workflows, not the other way around.
Study Support Tickets
When users repeatedly ask the same questions or report confusion, it’s a sign that some information isn’t clear. Address these pain points to streamline operations, reduce frustration and make the dashboard more intuitive for everyone.
Check Industry Trends
With logistics evolving rapidly, it’s important to stay on top of new tools and tech that could make your dashboard smarter.
Keep an eye on new tools and technologies: AI-powered analytics, predictive insights and personalised dashboards are quickly becoming standard.
Incorporating these innovations can elevate the experience for both internal teams and your customers.
Personas and Journey Mapping
Every role has different priorities. Fleet managers care about KPIs and delivery efficiency, while warehouse staff focus on inventory and order statuses.
Mapping each user’s journey and creating role-specific views reduces friction and makes the dashboard easier and more enjoyable to use.
Once you understand your users’ needs through research, it becomes clear that one-size-fits-all dashboards just don’t cut it.
Customisation is the key to keeping things relevant and efficient for every user.

One Dashboard Fits All? Not Anymore.
Let’s Talk Customisation:
Logistics teams are diverse. A fleet manager, a warehouse picker and a customer success rep all need access to logistics data, but they don’t need the same data.
When everyone’s forced to use the same dashboard, you end up with bloat, confusion and a whole lot of scrolling to find what matters.
And worse? People might start ignoring the dashboard altogether. If it doesn’t feel relevant, it’s just noise. Instead of designing one dashboard to rule them all, smart UX/UI leans into flexibility.
Here’s how:
1/ Role-Based Views
Start by tailoring dashboards to different roles within the organization. For example:
- Warehouse Managers might need insights on throughput, labor utilization or fulfillment rates.
- Pickers care about their assigned tasks, current order batches and the most efficient pick path through the warehouse.
- Fleet Managers want to track vehicle status, fuel efficiency or delivery windows.
- Customer Support might need customer SLA metrics, order status visibility and the ability to initiate follow-ups.
By mapping out user personas and their daily goals, you can create dashboard experiences that feel tailored and actually useful.
2/ User-Level Customization
Even within the same role, users may want different flavors of the same data. That’s where customization options come in:
- Widget-based Dashboards: Let users drag, drop and rearrange modules to suit their workflows.
- Saved Views & Filters: Allow users to save their favorite views, such as: “high-priority orders this week” or “late deliveries by region.”
- Dark Mode & Theme Options: A little personalisation goes a long way for adoption, especially for users working in warehouses or during night shifts.
- Notification Preferences: Let users choose what they want alerts for; some might care about order delays, others about restocking thresholds.

This level of control builds trust. When users feel like the tool is working for them, they’re more likely to engage with it regularly and rely on it for decisions.
3/ Smart Defaults with Conditional Logic
Personalization is great, but not everyone wants to fiddle with settings on day one. That’s where smart defaults come in.
Use conditional logic to automatically tailor views based on:
- Job title or department
- Location or facility
- Access level (admin vs. team lead vs. operator)
For example, a logistics company operating in multiple regions could have dashboards pre-filtered to show only relevant data for the user's assigned region. No need to manually dig through irrelevant info every time.
Why It Matters:
- Increased Efficiency: Users spend less time hunting for information and more time acting on it.
- Reduced Training Time: Intuitive, role-relevant dashboards mean new hires ramp up faster.
- Higher Adoption Rates: If people feel the dashboard was built for them, they’re more likely to use it.
- Better Decisions: When the right data is front and center, decisions are faster, smarter and more confident.
Real-World Example:
One 3PL company used a centralised logistics platform. Without customization, all users see a master dashboard filled with supplier data, vehicle diagnostics, regional performance and daily tasks; all mashed together.
But with role-based dashboards:
- The procurement team sees supplier reliability and cost per unit.
- The fleet manager gets vehicle maintenance alerts and fuel efficiency charts.
- The warehouse picker opens their tablet and immediately sees today’s pick list, sorted by optimal route.
Each team gets the right data, in the right format, without extra noise.
Frequent Logistics Design Challenges and Solutions
Let’s face it, logistics moves fast and so do the people in it.
But if your tools can’t keep up, even the best teams end up stuck in a tangle of outdated interfaces, inefficient workflows and overwhelming data.
However, a well-designed dashboard can turn those everyday frustrations into real business wins.
Here are some of the most common challenges we’ve seen logistics businesses face and the UI/UX design solutions we implemented to overcome them:
1/ Information Overload = Decision Paralysis
The Challenge:
Dashboards often try to be everything to everyone. The result? A cluttered wall of widgets, KPIs and endless scrolls of numbers that leave users frozen, unsure where to even look.
UX/UI Design Fix:
Clear the noise with a smart hierarchy. Highlight only the most critical KPIs based on user roles; for instance, a transportation dashboard might prioritize on-time delivery rate, cost per mile and number of delayed shipments, right at the top.
Less urgent metrics? Tuck them behind collapsible panels or tabbed menus.
Pro Tip:
Use minimalist data visualisations like cards, badges or emoji-style icons to signal status at a glance. Pair that with hover-over tooltips that explain why a number matters. This combo gives clarity without overwhelming the screen.
2/ No Context = Misleading Metrics
The Challenge:
Raw numbers don’t tell the full story. A 5% drop in warehouse throughput might seem minor until you realize it coincided with a spike in backorders from your biggest client.
UX/UI Design Fix:
Add micro-insights directly next to metrics. Think: trend arrows, percentage changes or anomaly alerts. These visual cues show whether something’s improving or slipping and help users interpret what to do next.
3/ Fragmented Customer Experience
The Challenge:
Customers today expect visibility, real-time status updates, proactive alerts and self-serve access. When dashboards are too generic, you get support tickets instead of satisfied clients.
UX/UI Design Fix:
Segment customer dashboards by profile type (e.g., bulk buyers vs. individual shippers). Personalise views to show only what matters: order history, SLA tracking, returns, etc. and make it intuitive to filter or search.
Pro Tip:
Replace long tracking logs with visual progress bars or order timelines. They communicate more clearly, faster and without frustration.
4/ Slow Internal Handoffs & Communication Gaps
The Challenge:
Important updates often get buried in emails or lost across teams. A delay in procurement can ripple into warehouse chaos before anyone even notices.
UX/UI Design Fix:
Build communication directly into your dashboard. Add task assignments, status flags (“awaiting PO,” “needs approval”) and in-context comments so teams collaborate where the data lives.
5/ No Forecasting = Constant Firefighting
The Challenge:
When users can’t see what’s coming, everything becomes reactive: scrambling to replenish inventory, reroute shipments or manage customer expectations.
UX/UI Design Fix:
Make forecasting visible and digestible. Use heatmaps to show demand spikes, confidence intervals to show prediction strength and thresholds to flag upcoming risks.
6/ Desktop-Only Dashboards Slow Down the Floor
The Challenge:
Field teams, like drivers and warehouse managers, need quick, mobile access to critical data. Desktop dashboards aren’t built for mobile use, leading to delays and errors in fast-paced, low-connectivity settings.
UX/UI Design Fix:
Design mobile-first, focusing on simplicity and efficiency. Use large tap targets for easy, on-the-go interactions and collapsible menus for smooth navigation.
Implement dark mode for low-light readability and offline functionality for uninterrupted work in low-connectivity areas.
Dashboard Customisation: In-House vs. Outsourced
When it comes to creating a custom dashboard for your logistics business, you have two options: build it in-house or partner with a design agency.
Let’s break it down:
In-House Customization: Full Control, But Time-Consuming
Building internally gives you total control and lets you shape the dashboard exactly around your workflows.
But it also requires time, focus and the right expertise, which can slow down other priorities.
If your team has the bandwidth and skills, it can be a strong option, just be prepared for the design, testing and refinement cycle.
Outsourcing: Expertise and Speed
Working with a design agency can fast-track the process and deliver a polished dashboard built on proven UX best practices.
You’ll gain access to specialists who understand logistics challenges and can guide strategy, design and implementation.
It may mean a higher upfront investment, but it often pays off in speed, quality and reduced internal strain, letting your team stay focused on growth.
So Which Approach Is Right for You?
It comes down to capacity and urgency:
- Have time and internal expertise? In-house might be a great fit.
- Need results fast and want expert guidance? Outsourcing is the smarter move.
Either way, a custom dashboard will help streamline operations, reduce errors and make your logistics business run smoother and more efficiently.
In logistics, efficiency is everything. But a well-designed, user-centric dashboard?
That's the tool that will take your operations to the next level.
Here’s how to make it happen:
- Research-driven UX: Design with real-world logistics challenges in mind.
- Actionable KPIs: Focus on the metrics that drive decisions.
- Efficient User Journeys: Remove friction, streamline tasks.
- Scalability: Build a dashboard that grows with your business.
Ready to Supercharge Your Logistics Operations?
Let’s create a dashboard that empowers your team to make smarter, faster decisions and drives your business forward.


.webp)
.webp)
